

EU updates PPWR reporting methodology as plastic use rises

Key takeaways
- The EU’s JRC updated its PPWR reporting methodology to help member states estimate and benchmark packaging waste quantities.
- Plastic was the only packaging category to grow between 2011 and 2025, rising by 11%, with 5.9 million metric tons placed on the market.
- Glass dominated by weight, accounting for 75% of packaging sold per capita in 2024, largely due to its higher density and reusable formats.
Plastic was the only packaging category that expanded between 2011 and 2025 in the EU, rising by 11%, a new European Commission (EC) Joint Research Center (JRC) study has found.
During the same period, packaging from the F&B sector was behind 97% of packaging material released on the market, while the total amount of all packaging on the market was 98 kg per capita.
This report uses an updated methodology to estimate the mass of packaging materials sold in 19 EU member states for F&B, home care, beauty and personal care, and pet food. According to the report, these sectors represent around 75% of consumer packaging in the EU.
“The developed methodology will be used to support EU member states in the mandatory reporting of packaging waste quantities, and will be used to benchmark the quantities reported, in the context of the monitoring of the attainment of the recycling targets set out in the Packaging and Packaging Waste Regulation (PPWR),” the report states.
“To this end, volume sales of consumer products by packaging type (differentiated by typology, size, and material) are combined with unitary mass coefficients associated with each packaging item. The report builds on an earlier version published in 2024, focused on the F&B sector.”
The study assessed packaging made of glass, plastic, metals, paper and cardboard, and composite materials, and sold in member states representing more than 97% of the EU population.
The revised JRC methodology was extended to cover new product categories of home care, personal care, and pet food, in addition to F&B.
Plastic usage persists
A total of 5.9 million metric tons of plastic packaging was put on the market, equivalent to 14 kg per capita, across the countries considered by the JRC from 2011 to 2025.
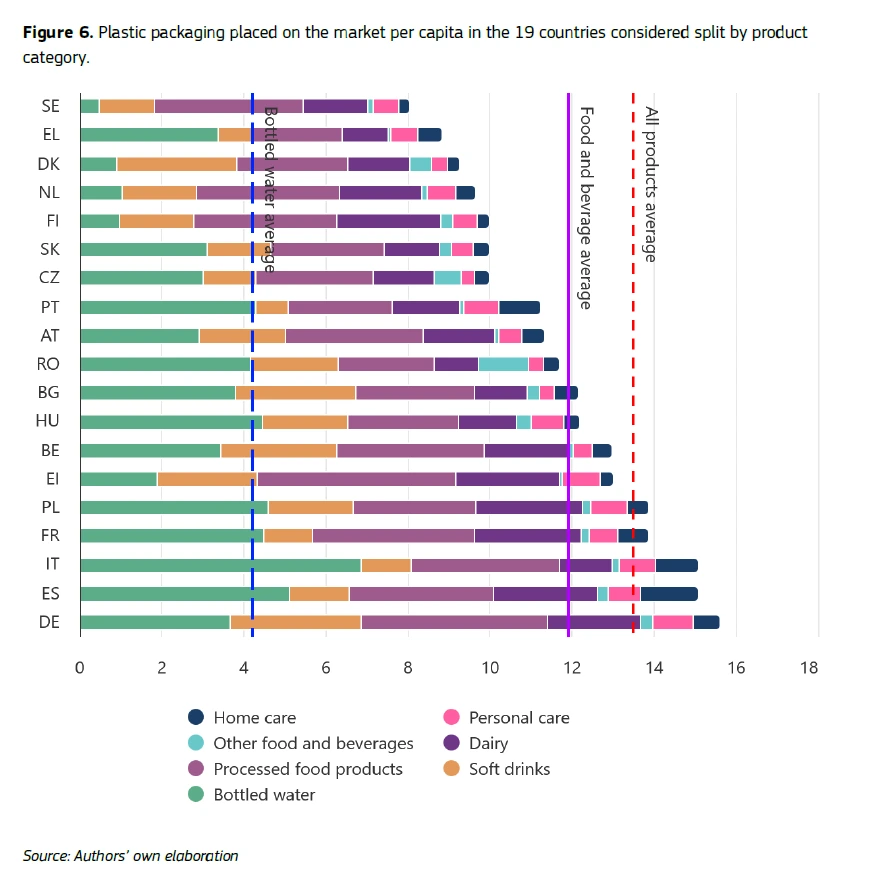 Plastic packaging placed on the market per capita in 19 EU countries, by product category (Image credit: JRC).PET, most commonly used to bottle water and soft drinks, emerged as the most common type of consumer plastic packaging. The exceptions are Finland, Ireland, the Netherlands, and Sweden, where PET use was lower than that of PP.
In Italy, plastic water bottles made up 46% of its total plastic consumption. Meanwhile, in Sweden, plastic bottles represented 6% of plastic packaging. Last year, Sweden increased the deposit fee for empty PET bottles and aluminum cans to boost its national recycling rate.
The overall quantity of plastic packaging was “relatively stable” in Belgium, the Netherlands, and France. At the same time, usage increased in Ireland, Romania, and Poland.
There were 16 kg of plastic packaging per person placed on the market in Germany in 2024, and 8 kg in Sweden. The average for the 19 countries taken into consideration was 14 kg.
While this new JRC research points to a rise in plastic packaging placed on the market, Eurostat data released last year, looking at plastic packaging waste in the EU, suggested that the tide is starting to turn and plastic waste is decreasing.
Glass dominates by weight
Glass made up the majority of packaging on the market by weight, the study found. Out of the 98 kg of packaging sold per capita in 2024, 75% was glass. The figures for glass, and to a lesser extent plastic, include reusable packaging, JRC adds.
The EC notes that this is due to its higher density. In the UK, the glass packaging industry urged for the packaging EPR to be paused due to the “penalization” of glass based on weight.
“Reusable and single-use glass bottles account for the largest share of packaging placed on the market, with beer ranking first at roughly 16.5 million metric tons. As for plastics, bottled water, dairy products, and carbonated soft drinks are the ones to weigh more on the scale.”
Overall, JRC estimates that a total of 42.8 metric tons of packaging was placed on the market in 2024. Of that total, glass represented 32.3 metric tons, plastic was 5.9 metric tons, paper (including liquid cartons) was 2.1 metric tons, metal made up 2.3 metric tons, and 0.1 metric tons were of mixed material.